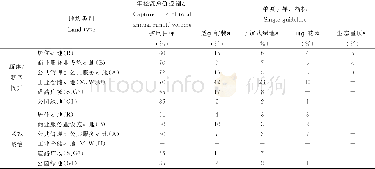
《Table 4 Analysis of decoupling indicators of cultivated land occupation and economic growth in Guiz
 提示:宽带有限、当前游客访问压缩模式
本系列图表出处文件名:随高清版一同展现
《基于脱钩理论的贵州省建设占用耕地与经济增长关系数据与分析》
As shown in Figure 2 and Table 4,for the 10 years from 2007 to 2016,the economic development of Guizhou province was rapid,and the nonagricultural GDP grew continuously during those 10 years.In general,the economy developed rapidly and increased from3,956.6×108 Yuan in 2007 to 13,104.69×108 Yuan in 2016.The increase was nearly 4-fold in 10years,and the total value increased by 9,148.09×108 Yuan.The change rate was slower before 2010,but it accelerated after 2010,with an overall trend of steady growth;whereas the 10-year GDP change rate rebounded slightly in 2010,and the overall trend showed a decline in volatility.The GDP output value was largest in 2011,compared with theprevious years,while the smallest growth rate was in 2015.The growth rate rebounded in2016.The overall GDP growth rate of Guizhou province in the 10-year period decreased primarily due to the small amount of the previous economic aggregate.Therefore,the change in growth rate was high.In the later period,the economic aggregate was large and the rate of change in economic growth was small,but the economy of Guizhou province continued to maintain a growth rate of at least 10%per year.In general,as shown in Figures2 and 3,the occupation of cultivated land and the nonagricultural GDP output in Guizhou province maintained a growth trend in the 10-year period.The trend for the nonagricultural GDP output value showed a steady increase,whereas the nonagricultural GDP output increased steadily but the occupation of cultivated land showed increased fluctuantly.
| 图表编号 | XD00110306900 严禁用于非法目的 |
|---|---|
| 绘制时间 | 2019.03.25 |
| 作者 | 刘青山、陈浒、陈静、王存璐、李林芝、杨乙未、张红梅 |
| 绘制单位 | 国家喀斯特石漠化防治工程技术研究中心、贵州师范大学喀斯特研究院、中国南方喀斯特生态环境学科创新引智基地、贵州省喀斯特山地生态环境省部共建国家重点实验培育基地、国家喀斯特石漠化防治工程技术研究中心、贵州师范大学喀斯特研究院、中国南方喀斯特生态环境学科创新引智基地、贵州省喀斯特山地生态环境省部共建国家重点实验培育基地、国家喀斯特石漠化防治工程技术研究中心、贵州师范大学喀斯特研究院、中国南方喀斯特生态环境学科创新引智基地、贵州省喀斯特山地生态环境省部共建国家重点实验培育基地、国家喀斯特石漠化防治工程技术研究中心 |
| 更多格式 | 高清、无水印(增值服务) |


